AI Diagram Generator
Flowcharts, Org Charts and Mind Maps
Free AI flowchart generator and diagram maker. Name three to seven nodes, pick a shape, and get a clean widescreen diagram back in about fifteen seconds — with the one thing it gets wrong shown to you rather than hidden.
Try the AI Diagram Generator — Free
Pick a diagram shape, then type your node labels in the box below it
AI Diagram Generator
Choose a diagram shape below, then type your own node labels into the box — for example “nodes read INTAKE, TRIAGE, BUILD, SHIP”. Spell each label exactly as you want it and keep to three to seven nodes of one to three words each. Everything comes out widescreen at 16:9. Read the labels as a list before you use the result: repeated labels, not misspellings, are the failure to watch for.
Everything here comes out widescreen at 16:9, the shape of a presentation slide. For a square mind map or a tall tree, use the ratio picker on the home page generator; to trim the empty margin above and below a single row of boxes, use the AI image cropper. To sit a diagram straight on your own slide background, drop the backdrop out with the AI background remover. Charts, numbers and percentages rather than boxes and arrows? That is the AI infographic generator.
AI Diagram Generator Examples
All six presets shown exactly as they came back — including the three that got a label wrong
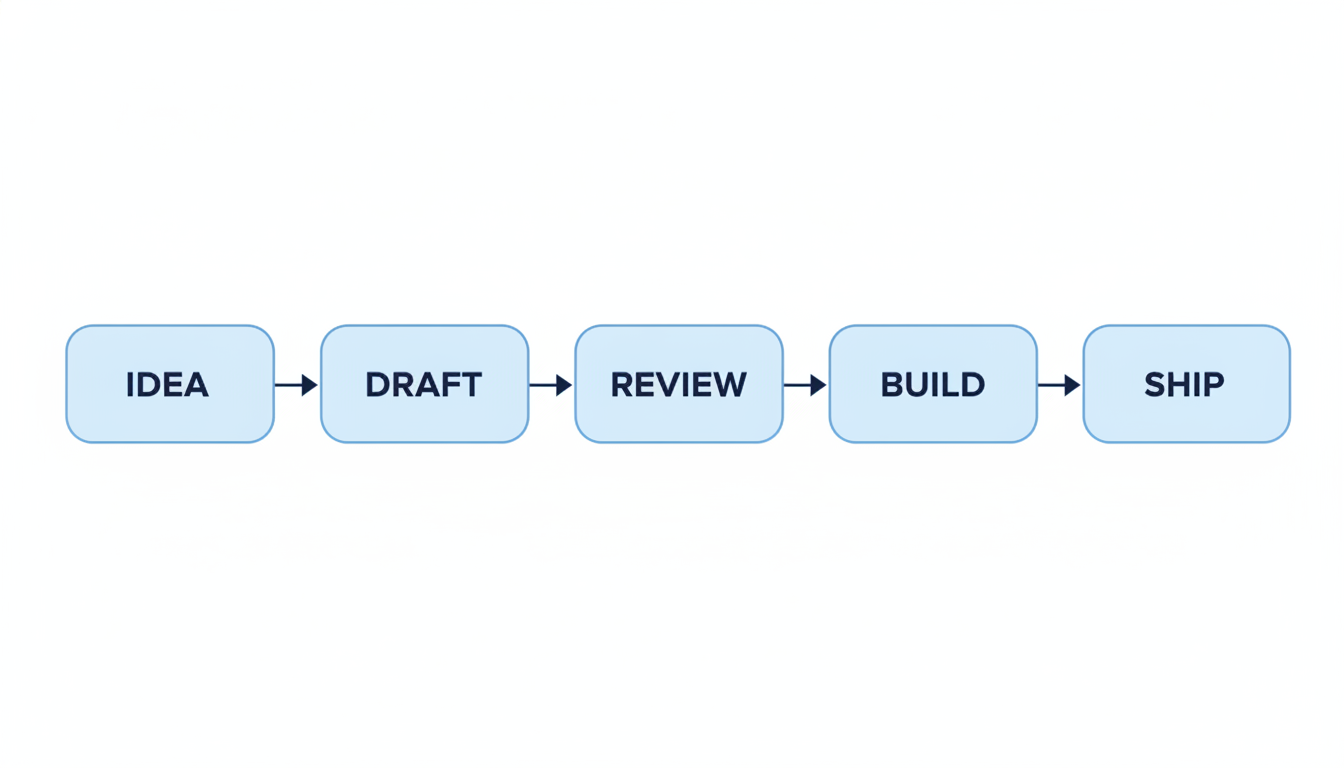
Five Step Flowchart — All Five Labels Correct
Asked for five boxes reading IDEA, DRAFT, REVIEW, BUILD, SHIP. Got exactly that, in order, evenly spaced.
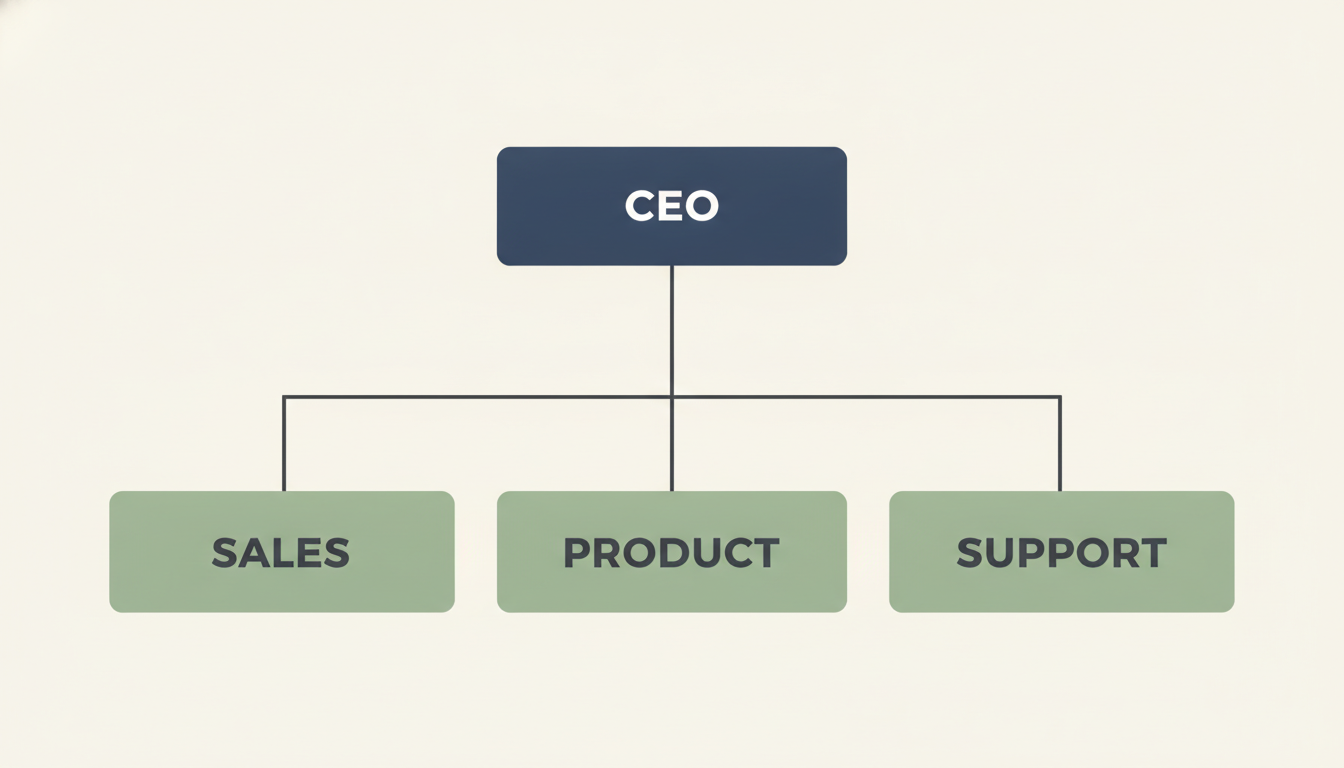
Org Chart — Right Angle Connectors, Correct Roles
One box over three, joined with true right angle elbows and each drop landing on the centre of its box.

Mind Map — Eight Branches When Six Were Asked For
The clearest failure on the page. Six branches were requested; eight came back, and rather than invent two new topics the model repeated VIDEO and ADS. Every word is spelled correctly.
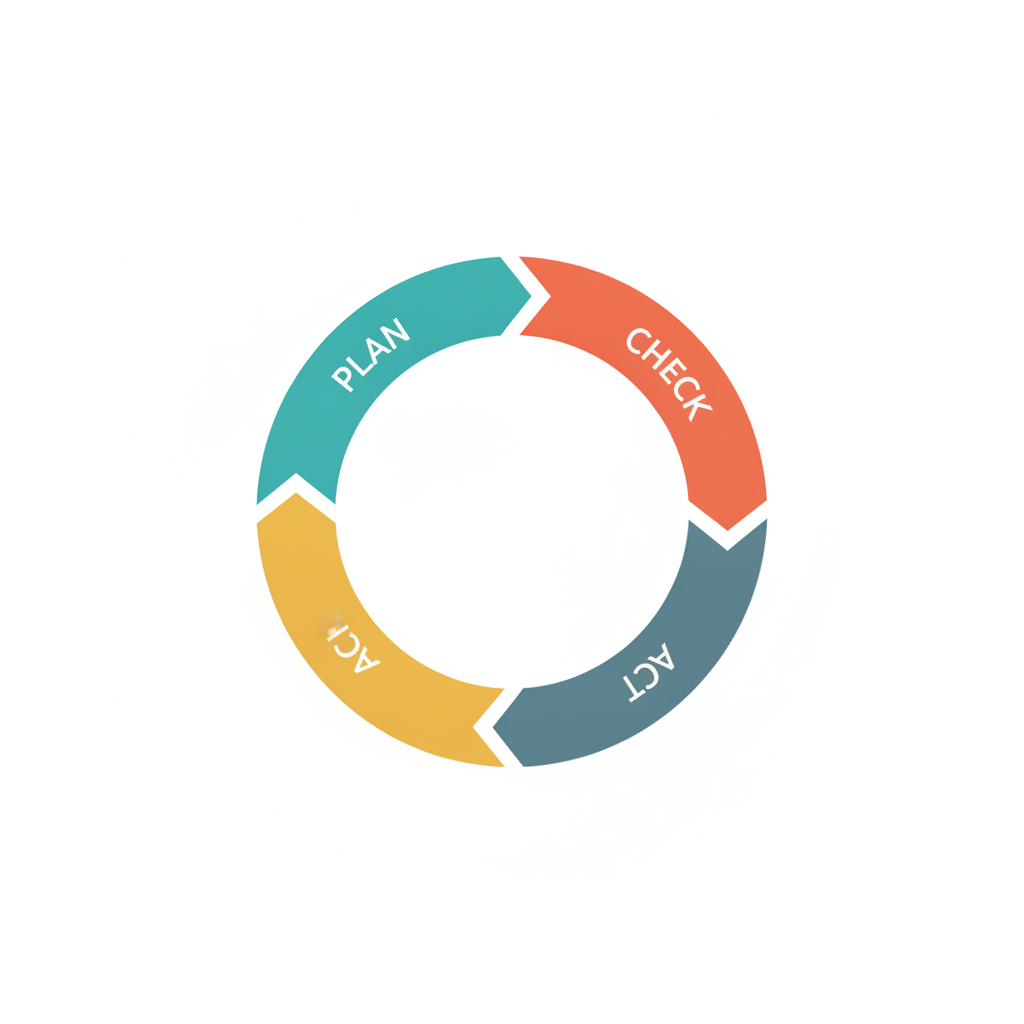
Cycle Diagram — PLAN, CHECK, ACT and ACT Again
Four segments, correct count, correct clockwise arrows. But DO was dropped and ACT rendered twice, and the mustard one is set upside down.
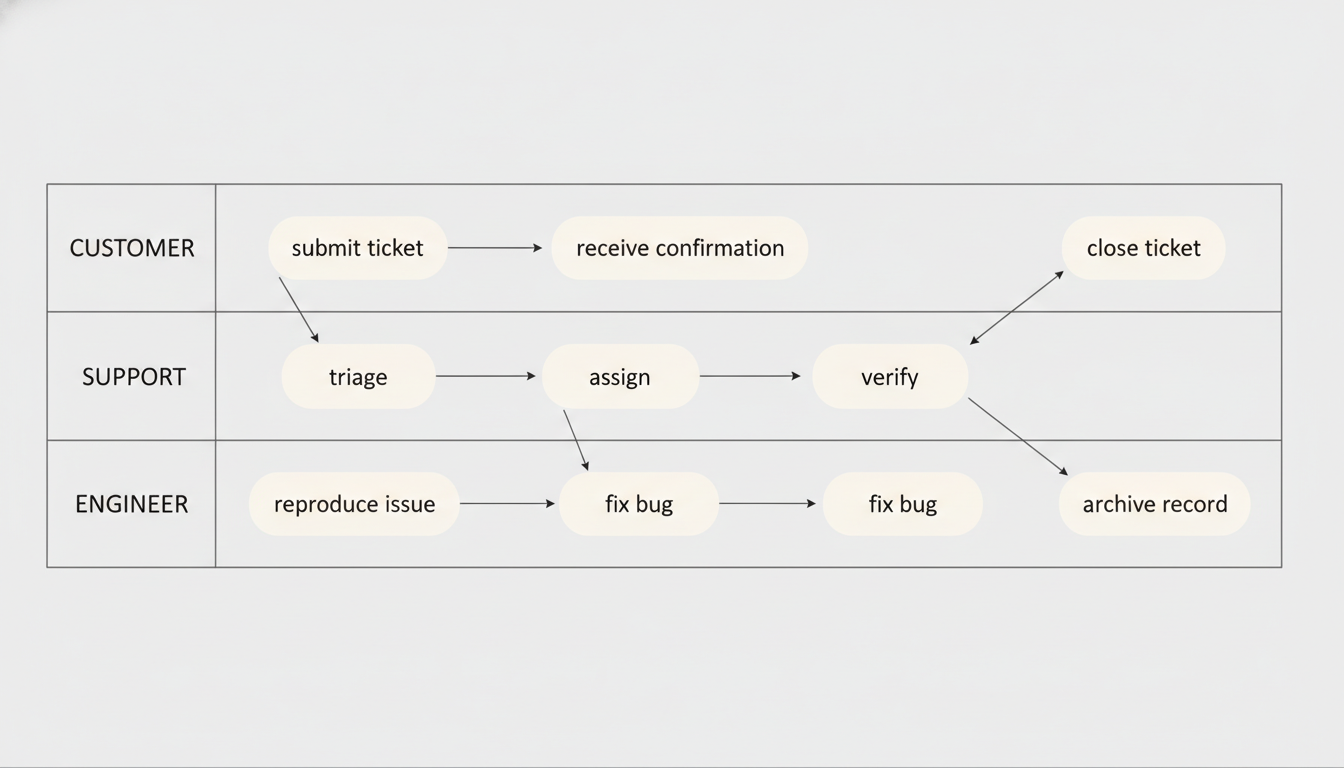
Swimlane — and “Fix Bug” Twice in a Row
Lanes, header strip and diagonal cross lane arrows are all structurally right. Then the engineer lane fixes the same bug twice, and one arrow grew a second head.
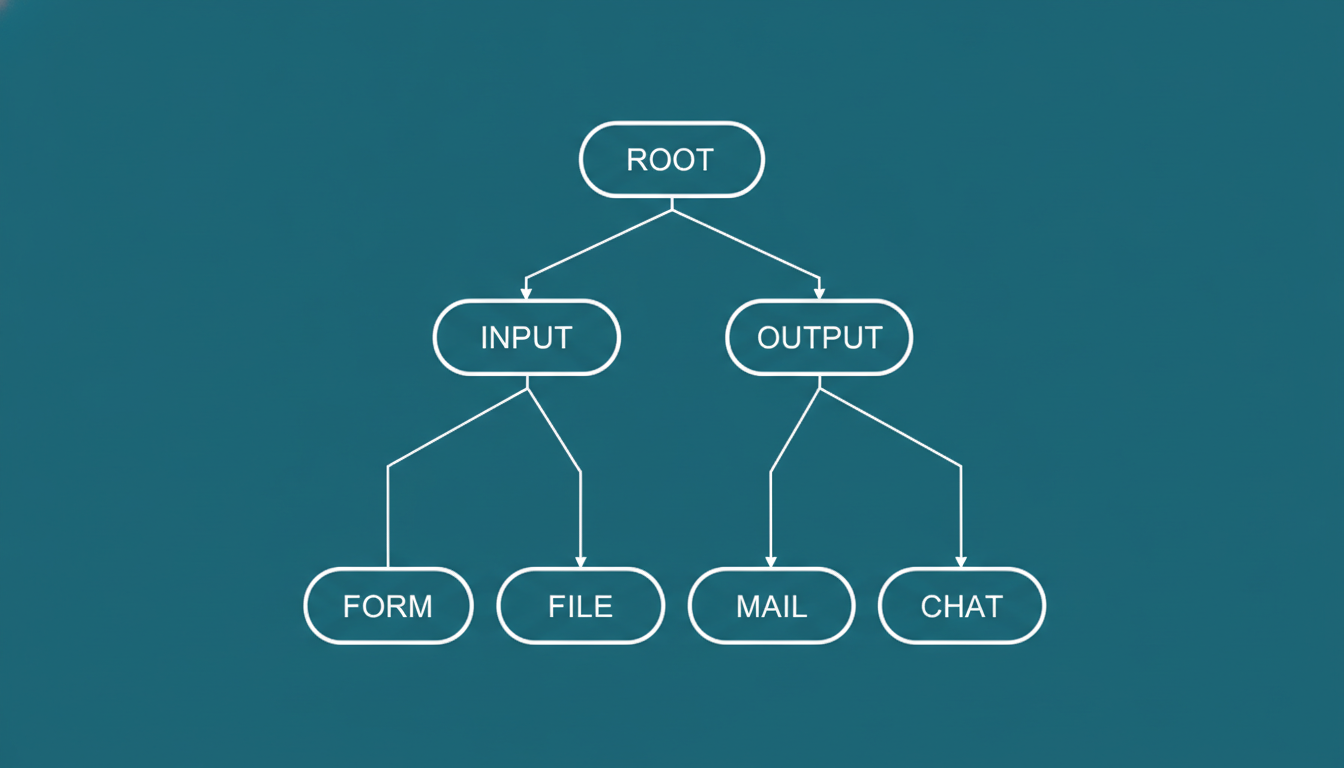
Hierarchy Tree — Seven Nodes, Three Levels, No Errors
Branching is correct all the way down. The only slip is a missing arrowhead on the line into FORM.
Three Things to Know Before You Generate
It draws diagrams, it does not build them. GPT Image 2 is an image model, so the result is a picture of a flowchart rather than a chart made of real shapes. It is a flat PNG — nothing to drag, no text layer to retype, no connector to re-route. Regenerating a bad label is faster than editing one. Duplicate labels are the failure mode, not spelling. All forty-two labels in the gallery above are spelled correctly, and three of the six diagrams still went wrong: the mind map drew eight branches instead of six and repeated VIDEO and ADS, the cycle lost DO and rendered ACT twice, and the swimlane fixed the same bug twice in a row. Clean typography is exactly what makes these easy to miss, so read your labels as a list and count your nodes. And stay between three and seven nodes. The three diagrams that came back perfect were laid out in a straight row or as a top-down tree; the three that failed wrap nodes around a shape or across lanes. Left to right and top to bottom are reliable, radial and cyclic need checking, and thirty editable nodes need a real diagramming editor instead.
How the AI Diagram Generator Works
Pick a shape, name the nodes, then check them
Pick the Shape
Flowchart for a sequence, org chart for reporting lines, mind map for branching ideas, cycle for a repeating loop, swimlane for a process crossing teams, tree for a hierarchy. The shape is the argument, so choose it first.
Name the Nodes
Type your labels into the custom box, spelled exactly as you want them and separated by commas — “nodes read INTAKE, TRIAGE, BUILD, SHIP”. Three to seven nodes of one to three words each is the reliable range.
Read the Labels Before You Use It
Count the nodes and read the labels as a list. Duplicates are the failure to look for, not misspellings, and they hide well because the lettering is clean. Regenerate if one is wrong — it takes fifteen seconds.
Why Use an AI Diagram Generator
Because dragging boxes around for twenty minutes is not the interesting part of the job
Structure, Not Statistics
Boxes, arrows, hierarchies, lanes and cycles. Every preset here is about what connects to what — no bar charts, no percentages, no data storytelling. That is the infographic tool, and it is a different job.
Labels That Actually Read
Forty-two labels across the six gallery images and not one misspelling. Short words in plain capitals come back clean and evenly spaced, which is the part older image models never managed.
Honest About the Duplicate Label Problem
Three of six examples repeated a label rather than rendering the one they dropped. We left all three in the gallery and named them, because a flaw you can see is one you can check for.
Six Shapes, Not One
Linear flowchart, org chart, radial mind map, cycle ring, swimlane process and hierarchy tree. Pick the shape that matches the relationship you are describing rather than forcing everything into boxes and arrows.
Slide Shaped by Default
Locked to 16:9, the same ratio as a presentation slide, because that is where most of these end up. Drop it straight into the deck with no resizing.
Free, No Sign Up, No Watermark
About fifteen seconds per diagram and nothing stamped on the download. Try three layouts before you decide which one goes in the deck.
Who Uses It
Teachers, product managers, consultants and founders who need the picture today
Teachers and Trainers
The water cycle, the branches of government, the stages of mitosis. A fresh cycle diagram or hierarchy tree per lesson beats the same photocopied worksheet, and 16:9 drops straight onto a slide.
Product Managers
The swimlane preset is the one for a handoff between teams, and the flowchart for a user journey. Generate the visual draft, argue about it in the review, then build it properly once the shape is agreed.
Consultants and Founders
An org chart for the deck, a four stage cycle for the methodology slide, a mind map for the workshop recap. Six shapes covers most of what a pitch or a proposal actually needs.
Students
Revision mind maps, essay structure trees and process diagrams for a lab report. Free with no account, which matters more at 2am the night before than any feature does.
AI Diagram Generator FAQ
Label accuracy, node limits, editing, sizes, and how it differs from an infographic
Free AI Diagram Generator — Structure, Not Statistics
A diagram answers a different question from a chart. A chart is about quantity — how much, how many, which is growing. A diagram is about structure — what connects to what, who reports to whom, what happens after what, and what loops back round to the start. That distinction is the whole reason this page exists separately from the AI infographic generator, which is built for data storytelling with figures and bar charts in it. Every preset on this page produces boxes, arrows, hierarchies, lanes and rings and nothing else. If your sentence has a number in it, you probably want the infographic tool. If your sentence has the word “then” or the word “under” in it, you want this one.
The six shapes cover the relationships people actually need to draw. A flowchart is for a sequence, one thing after another in a straight line. An org chart is for reporting lines, one box over several. A mind map is for branching association, a central idea with topics radiating off it. A cycle diagram is for a process with no end, the four stages that feed back into each other. A swimlane is for a process that crosses teams, which is the diagram that exists mainly to show where the handoffs are. And a hierarchy tree is for classification, one root splitting downward through levels. Choosing the shape is the real decision, because the shape is itself an argument about how the thing works — drawing a cycle as a flowchart quietly claims it has an ending. All six are in the gallery above at the size the tool produces them, unretouched.
Now the honest part, because it is more specific and more useful than the usual warning about AI and text. GPT Image 2 spells beautifully. There are forty-two separate labels across those six images and every single one is correctly spelled, cleanly kerned and properly weighted, which is a genuine break from the older image models that turned every diagram into letter soup. The problem has moved somewhere harder to spot. Three of the six diagrams have the wrong set of labels: the mind map was asked for six branches and drew eight, repeating VIDEO and ADS rather than inventing two new topics; the cycle was asked for PLAN, DO, CHECK, ACT and returned PLAN, CHECK, ACT and ACT, silently deleting an entire stage of a four-stage process; the swimlane has the engineering lane fixing the same bug twice in a row. Not one of those is a typo. Each is a confident, well-set, professional-looking image that says something untrue, and the quality of the lettering is precisely what stops you noticing. So the rule for this tool is not “check the spelling” — it is count the nodes and read the labels as a list, separately from looking at the picture.
There is a pattern in which ones failed, and it is worth knowing before you pick a shape. The three that came back perfect — the flowchart, the org chart and the hierarchy tree — all lay their nodes out in reading order, left to right or top to bottom. The three that went wrong all place nodes somewhere reading order does not go: around a circle, around a ring, or stepping between horizontal lanes. Stay between three and seven nodes with one to three words each, prefer a linear or top-down layout when you have the choice, and this is reliable; go radial or past eight nodes and you are proofreading. If you need a thirty-node chart you can edit next quarter, use a real diagramming editor and come back here for the version that has to look good in a deck on Thursday. For the rest of the workflow: everything here is 16:9 to match a slide, the AI image cropper trims the empty margin a single row of boxes leaves behind, the AI background remover drops the white backdrop so the boxes sit on your own slide, the AI image upscaler pushes a diagram up to print size, and the AI icon generator makes the little symbols to sit inside the boxes. Scroll back up, pick a shape, and name your nodes.